KaHero POS is partnered with KaHero Sales Analytics App. The analytics app displays all the transactions going on KaHero POS in real time. It shows your business' data and allowing you to make quick decisions based on the data being shown. You can even view your data with the convenience of your phone.
Sign in to KaHero Sales Analytics with the same email and password as your KaHero POS app
After logging in, you will be sent to the sales summary screen. You will see the number of transactions, the total sales, and the average sales amount. A bar graph showing the amount of sales made during a period of time is also shown. Click the arrow to proceed to a more detailed information about a specific day.
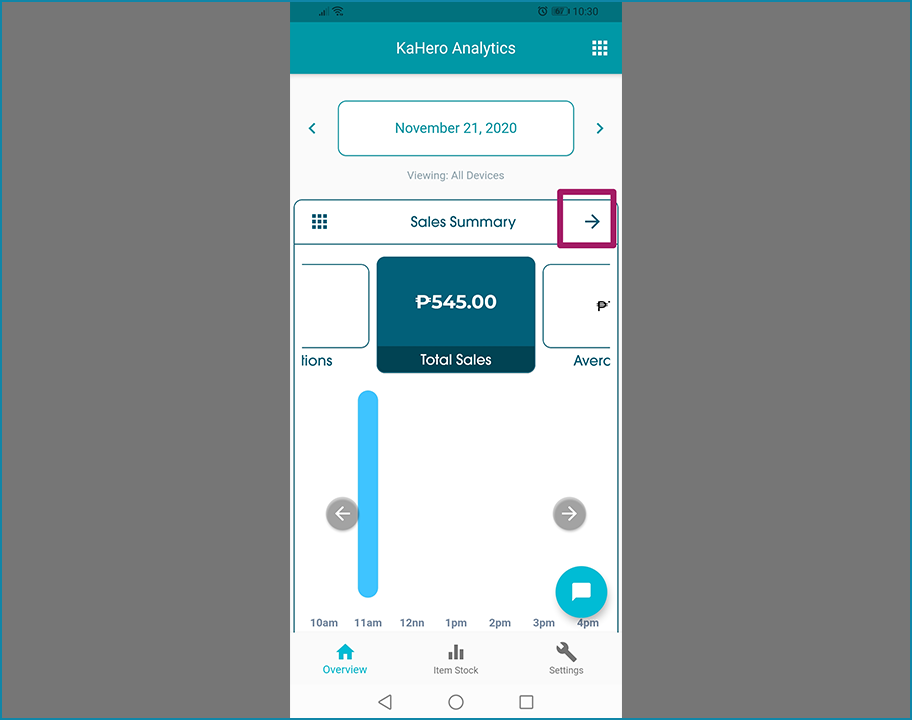
Sales Summary
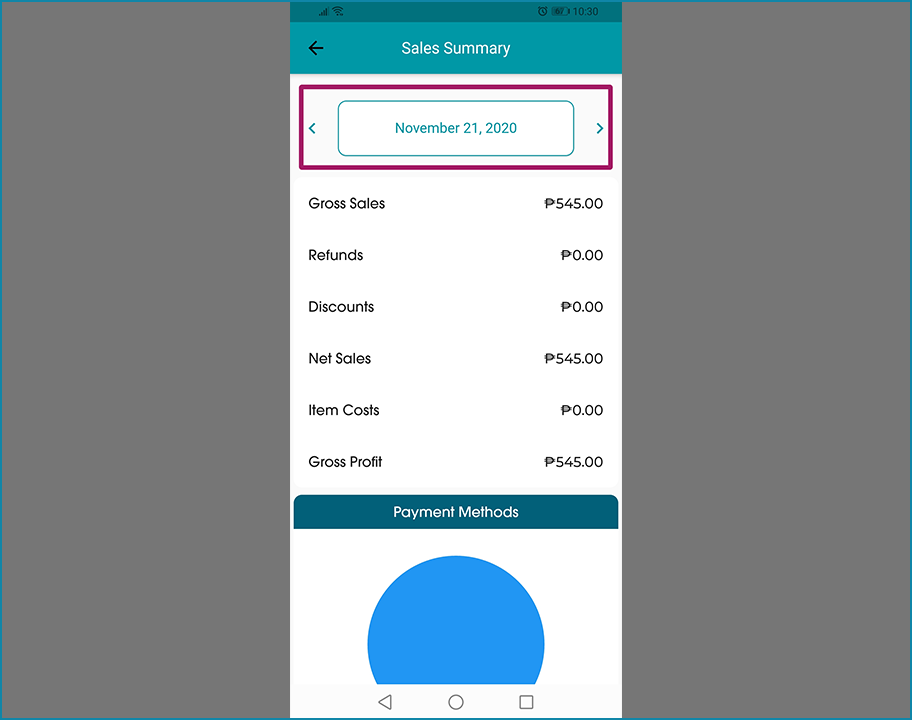
This is a more detailed summary about a certain sales day. This shows your gross sales, refunds, discounts, net sales, item costs, and gross profit.
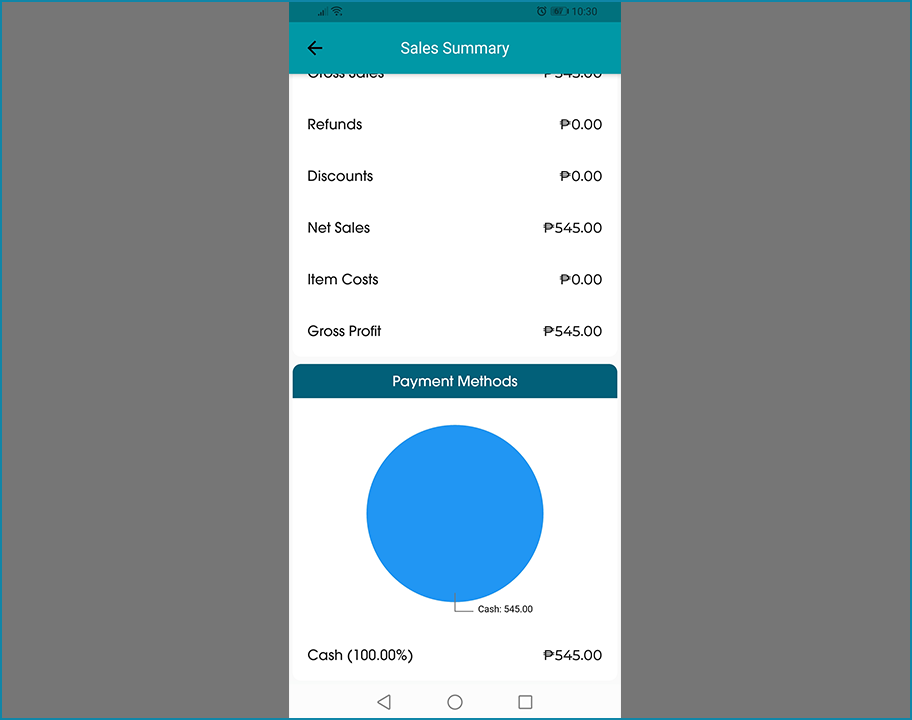
Payment Methods
Under the sales summary screen is a pie chart of all the transactions in categorized by payment methods.
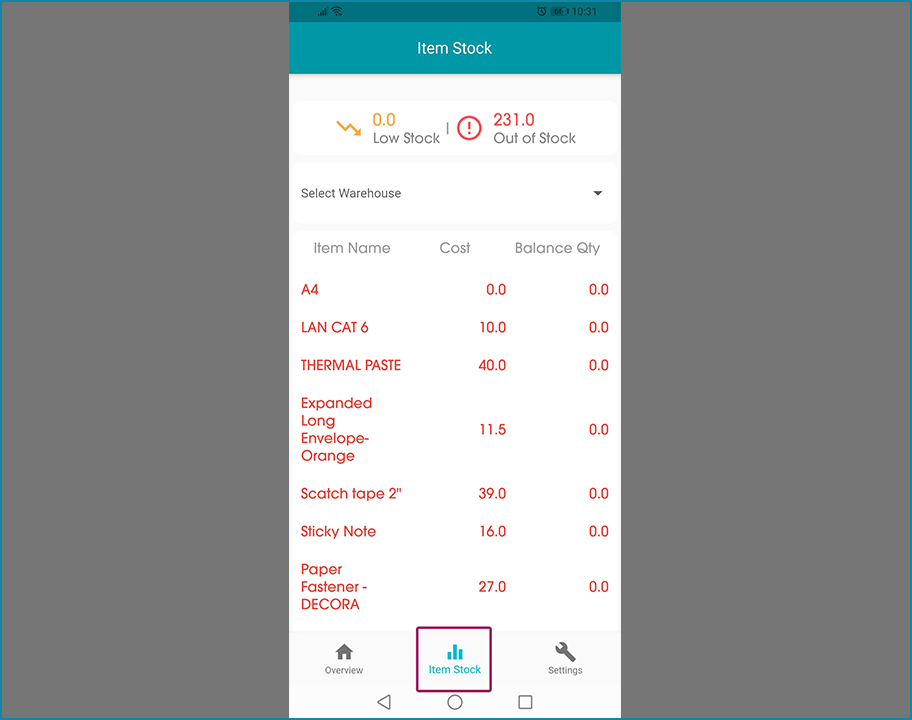
Item Stocks
This is where you can view the movement of your item stocks. This is also where you can find out whether your items are low on stock or out of stock. You can also sort your items based on warehouse storage.
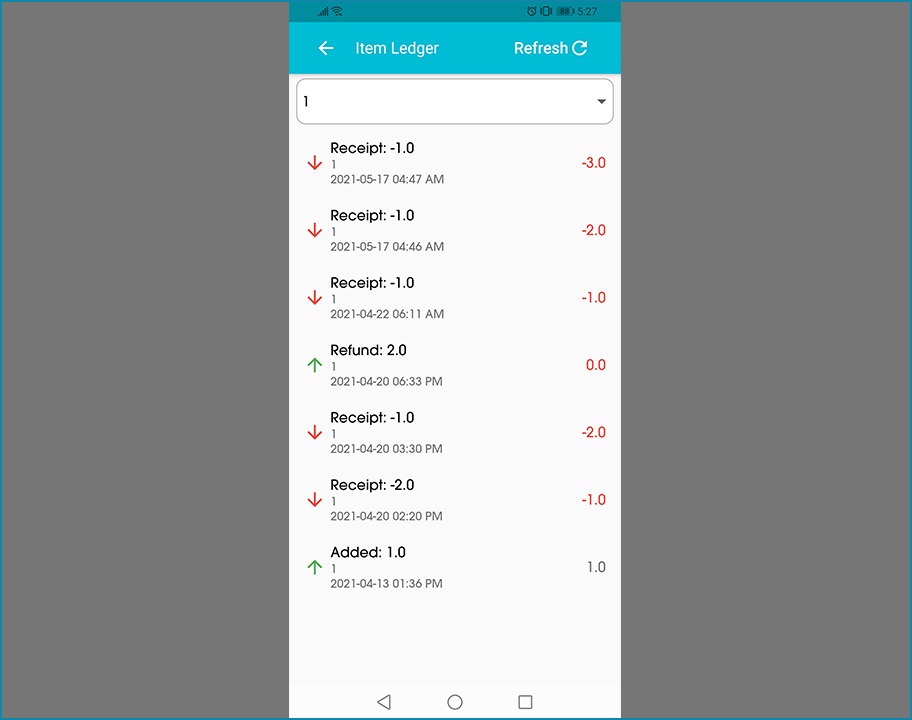
Item Ledger
By clicking on an item on Item Stocks, you will be able to see the item's ledger. You will see all the movements of the specific item whether it was purchased by a customer, refunded, or added to the stocks.