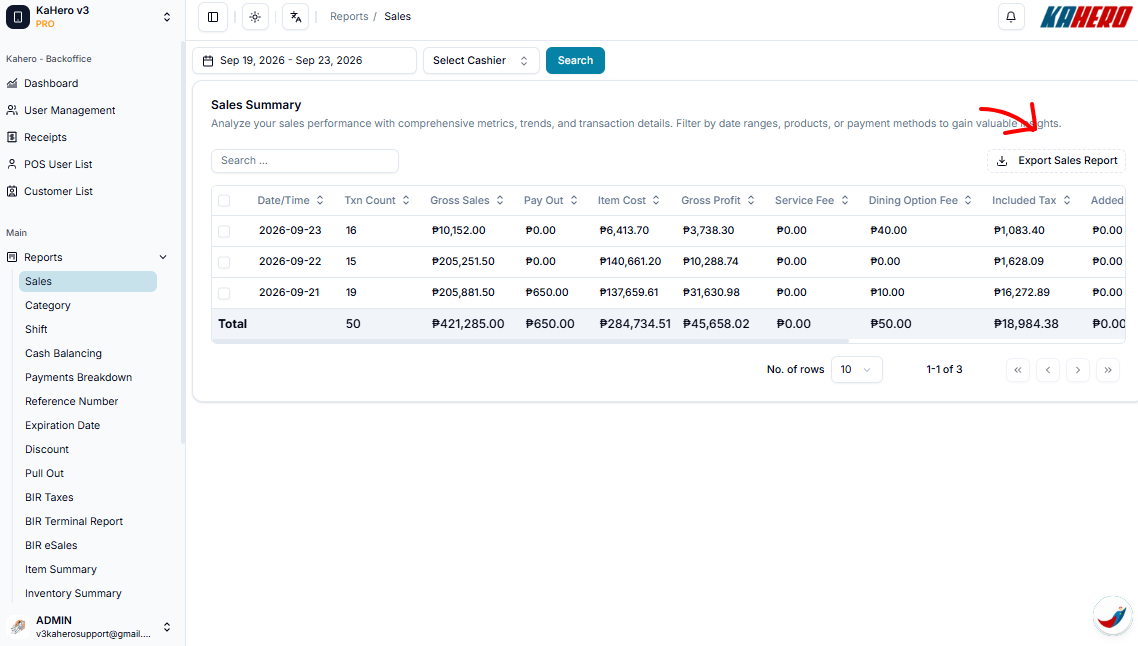
KaHero POS's back office helps you see all important information about your daily sales and transactions. You can access the back office through KaHero POS app or app.kahero.co
This is your "Dashboard" screen.
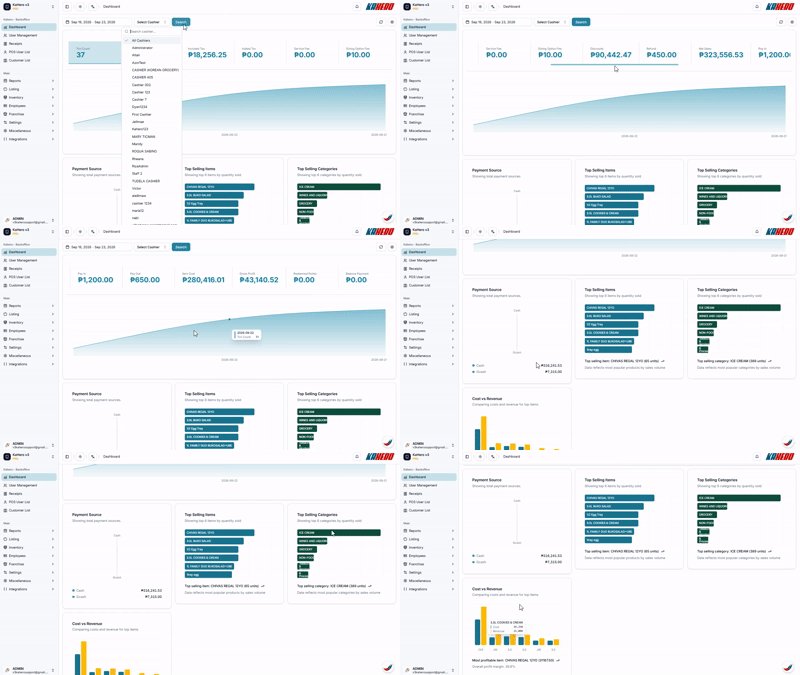
Specify which graph reports you'd like to see.
A. Select a range of date to view.
B. Select the specific cashier

The Dashboard provides a quick overview of your store's sales performance, including:
- Txn Count – total number of transactions.
- Gross Sales – total sales before deductions.
- Included Tax – tax included in the sales.
- Added Tax – additional tax collected.
- Service Fee – service fees collected.
- Dining Option Fee – fees based on the dining option.
- Discounts – total discounts applied.
- Refund – total refunded amount.
- Net Sales – sales after applicable deductions.
- Pay In – cash added into the cash drawer / register.
- Pay Out – cash taken out of the cash drawer / register.
- Item Cost – total cost of the items sold.
- Gross Profit – your profit after subtracting the cost of the items sold.
- Redeemed Points – total value of loyalty points that customers used as payment or discount during the period.
- Balance Payment – payments made toward remaining balances (usually from partial-payment or open-ticket transactions).
Below the summary, you can also view sales trends, payment sources, top-selling items, and top-selling categories for the selected period.
Tip: Always check the date range before reviewing the figures to make sure the Dashboard is showing the correct period.
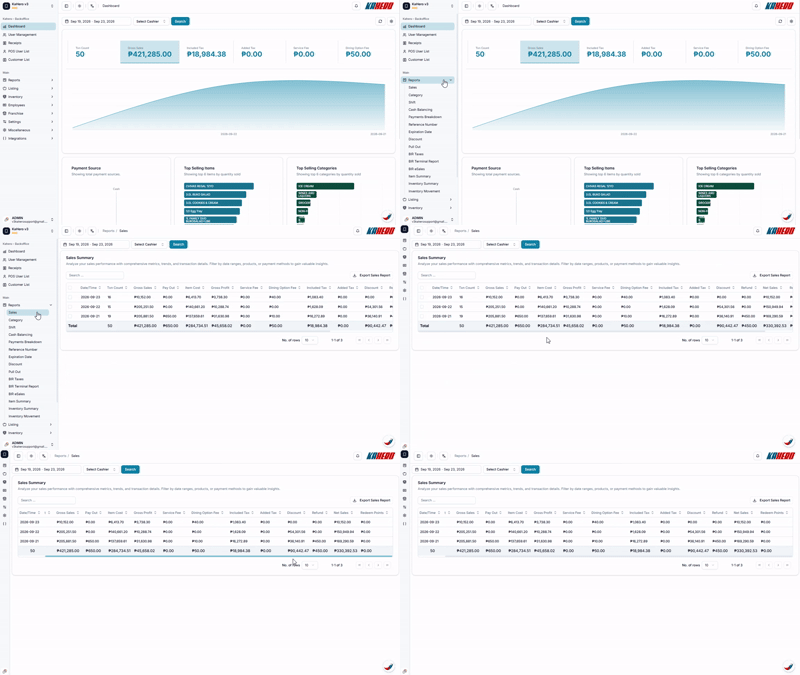
Navigate Sales Summary through Reports > Sales. This displays a list of your sales per date period you've selected.
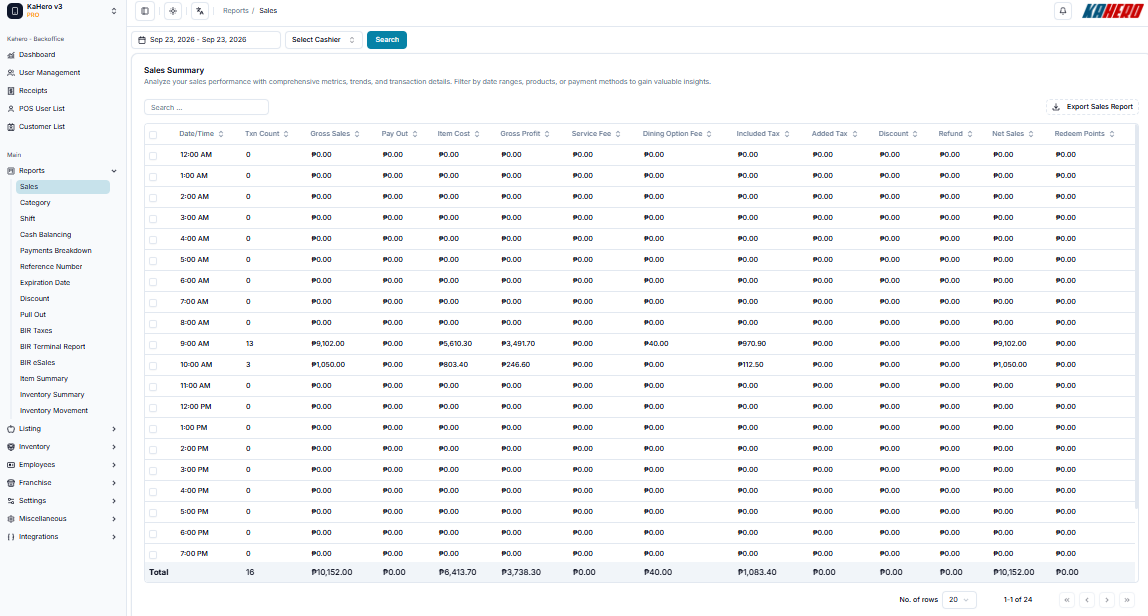
| Date/Time | The date of the sales |
| Txn Count | Number of transactions that day |
| Gross Sales | Total sales before any deductions |
| Pay Out | Cash taken out of the register that day |
| Item Cost | Total cost of the products sold |
| Gross Profit | Gross Sales minus the Item Cost |
| Service Fee | Any service charges collected |
| Dining Option Fee | Fees related to dining options |
| Included Tax | Tax that was already included in the item prices |
| Added Tax | Extra tax added on top of the prices |
| Discount | Total discounts given that day |
| Refund | Total amount refunded to customers |
| Net Sales | Final sales amount after discounts and refunds |
| Redeem Points | Value of loyalty points redeemed by customers |
You can also view the specific time and sales for a particular date by setting the date filter at the top to a single day. This will display the sales and transactions recorded for that specific date.
Under Reports > Category, this display shows the Sales per category within the certain period.
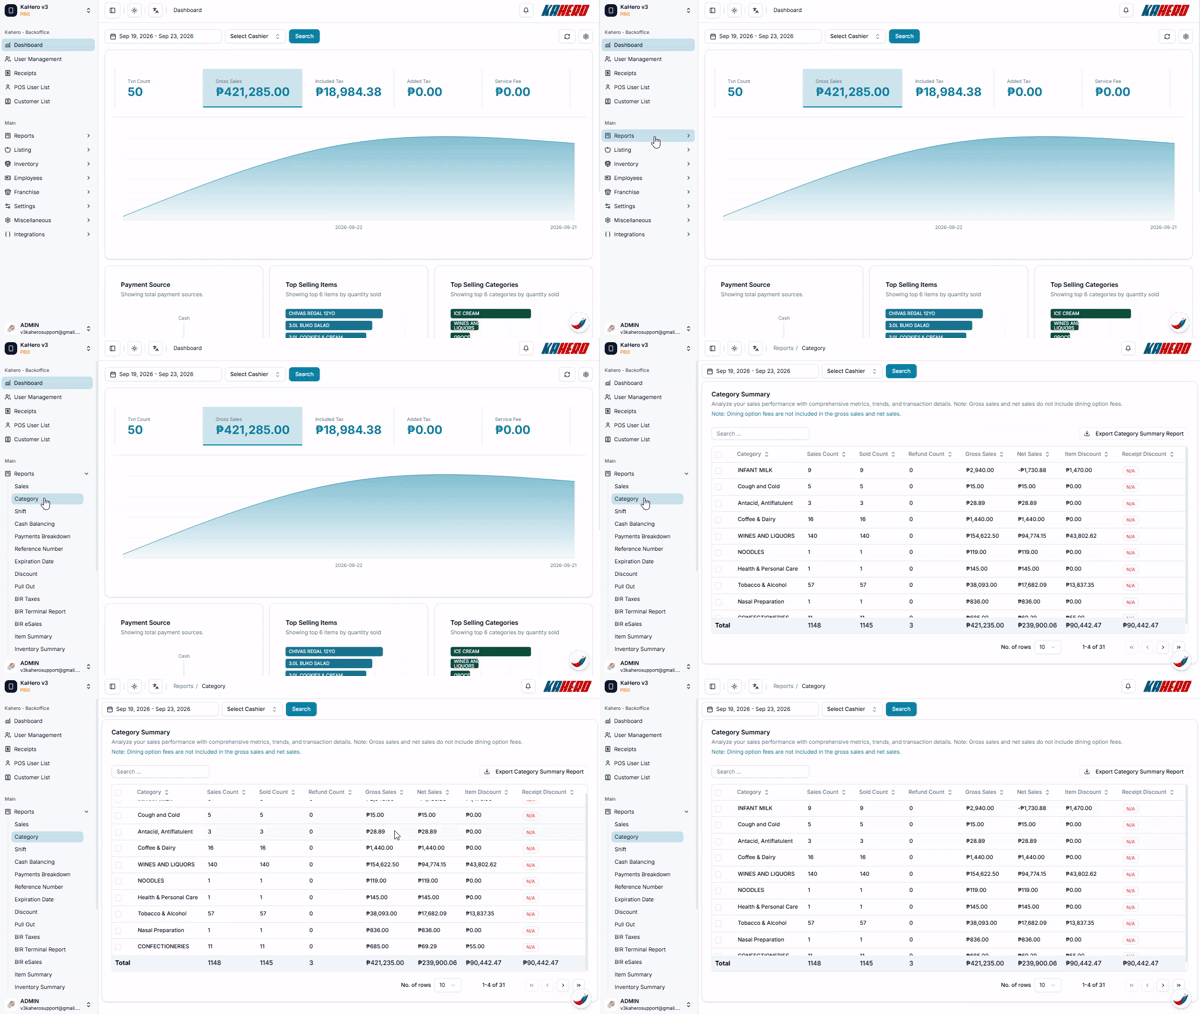
Once you're on the page, you can review sales performance by category, including:
| Category | Name of the product category |
| Sales Count | Number of transactions that included items from this category |
| Sold Count | Total quantity of items sold from this category |
| Refund Count | Number of items from this category that were refunded |
| Gross Sales | Total sales amount from this category (before discounts/refunds) |
| Net Sales | Final sales amount after discounts and refunds |
| Item Discount | Discounts applied directly to items in this category |
| Receipt Discount | Discounts applied to the whole receipt (shown as N/A when none) |
In the pages of these reports, you can export each report separately located on the upper right corner.